 |
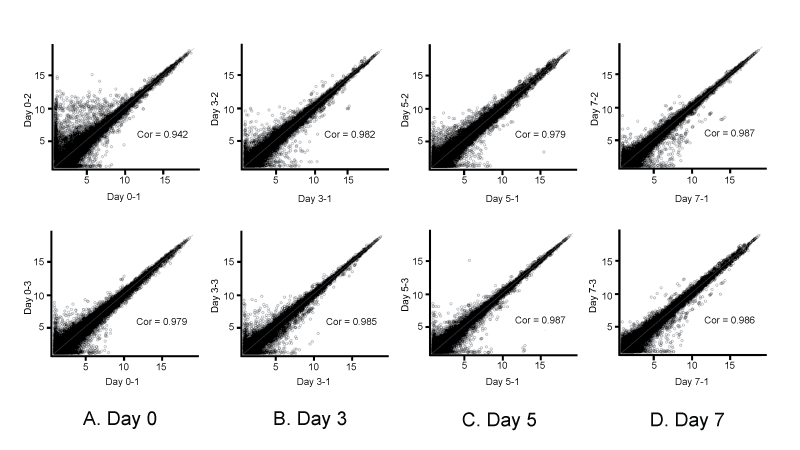
| Figure 2: Scatterplots of gene expression among three samples at each time point after SAH. Gene expression levels among control animals (day 0) (A) and day 3 (B), day 5 (C), and day 7 (D) SAH animals. Each plot represents signal intensity of individual genes from each sample. The x and y axes are log2-transformed raw signal intensities. The number following the hyphen is the sample number (each time point has three numbers: 1, 2, and 3). Cor, correlation coefficient. |