 |
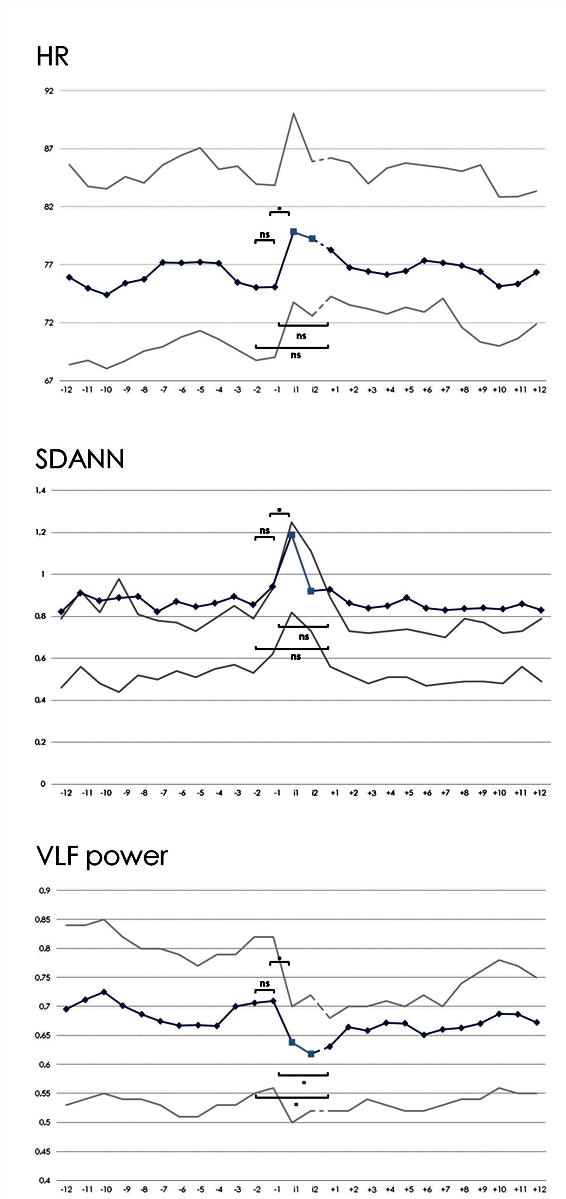
| Figure 1: Average pattern of heart rate and linear heart rate variability indices which demonstrated significant peri-ictal changes in the epilepsy group. The blue line represents the average HR/HRV characteristic, with 95% confidence intervals in grey. Each interval lasted approximately 5 minutes: Intervals -12 to -1 comprise the hour preceding the seizure, the intervals i1 and i2 cover the seizure, and the hour following the seizure consists of the intervals +1 to +12. The line between interval i2 and +1 is dashed because not all patients had episodes consisting of exactly 2 intervals. * = p<0.05, ns=Not significant. HR=heart rate, SDANN=standard deviation of average NN intervals, VLF=very low frequency. |