 |
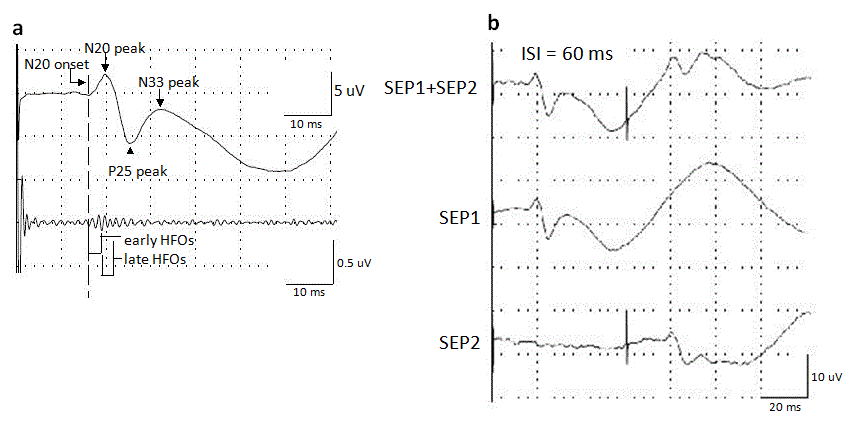
| Figure 1: (a) The top row shows SEPs elicited by single-pulse stimulation, and the bottom SEPs were digitally filtered at 500–1000 Hz. (b) The top row shows SEPs (SEP1+SEP2) elicited by paired-pulse stimulation (ISI = 60 ms), and SEP1 are elicited by single-pulse stimulation. SEP2 are obtained by subtracting SEP1 from SEP1+SEP2. |