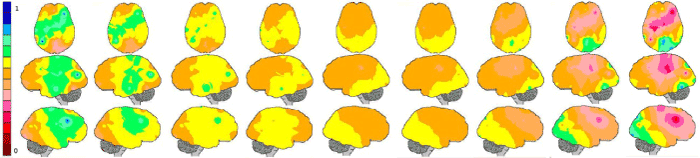
Figure 4:
Brain mapping of the most discriminant entropy values (red to blue) captured by the LDA hyperplane navigation. From left (group of NO samples) to right (group of LD samples).