 |
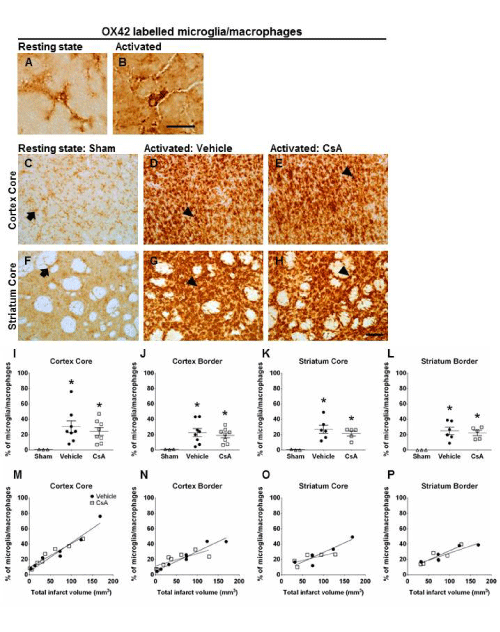
| Figure 3: Effect of CsA on activated microglia and macrophages 7 days post-stroke and correlation with infarct volume. Immunohistochemical photomicrographs of OX42 labeled microglia/macrophages in consistent sample areas within the cortex (A-C) and striatum (D-F) representing resting states within the ipsilateral hemisphere of sham-operated controls and activated states within the core damaged regions of the ipsilateral hemisphere from both vehicle and CsA treated animals 7 days post-stroke. Short arrows represent cells in resting states with highly ramified processes, while arrow heads indicate activated microglia and blood borne macrophages with amoeboid morphology, large cell bodies and retracted processes. Scatter plots demonstrate no significant differences in the number of microglia/macrophages between treatment groups in all regions analysed (G-J) (ANOVA). Data are presented as mean ± SEM, *P<0.05 compared to sham-operated animals. A positive correlation was observed between infarct volumes and activation of microglia/macrophages in the core cortex (vehicle: r=0.96, P<0.0005, n=8, CsA: r=0.97, P<0.0001, n=8; K) and border cortex (vehicle: r=0.97, P<0.0001, CsA: r=0.78, P<0.05; L) of both treatment groups, core striatum (vehicle: r=0.90, P<0.05, n=5, CsA: r=0.74, n=5; M) of the vehicle treated rats only, and striatal border of both treatment groups (vehicle: r=0.91, P<0.05, n=5, CsA: r=0.92, P<0.05, n=5; N) (Pearson product moment correlation coefficients). Scale bars A-F = 100μm. CsA: Cyclosporine A; OX42: CD11b antigen on microglia/macrophages. |