 |
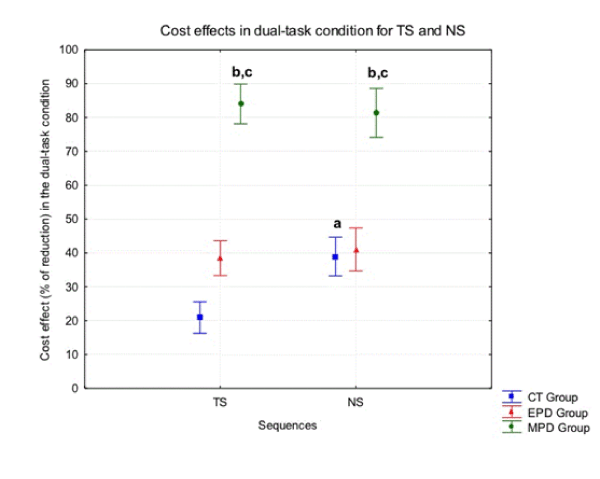
| Figure 2: Mean percentage of reduction (+ S.E.M.) in the number of sequences performed correctly by the Early (EPD) and Intermediate (MPD=IPD) PD patients, and Control (CT) subjects, during performance of trained (TS) and novel (NS) sequences, in the dual-task condition relative to that seen in the single-task condition (performance in the corresponding single-task condition was taken as 100%). a. Post-hoc Tukey tests: TS X NS comparison: p<0.005. b. Post-hoc Tukey tests: early PD group x intermediate PD group comparison: p<0.001. c. Post-hoc Tukey tests: control group x intermediate PD group comparison: p<0.001. |