 |
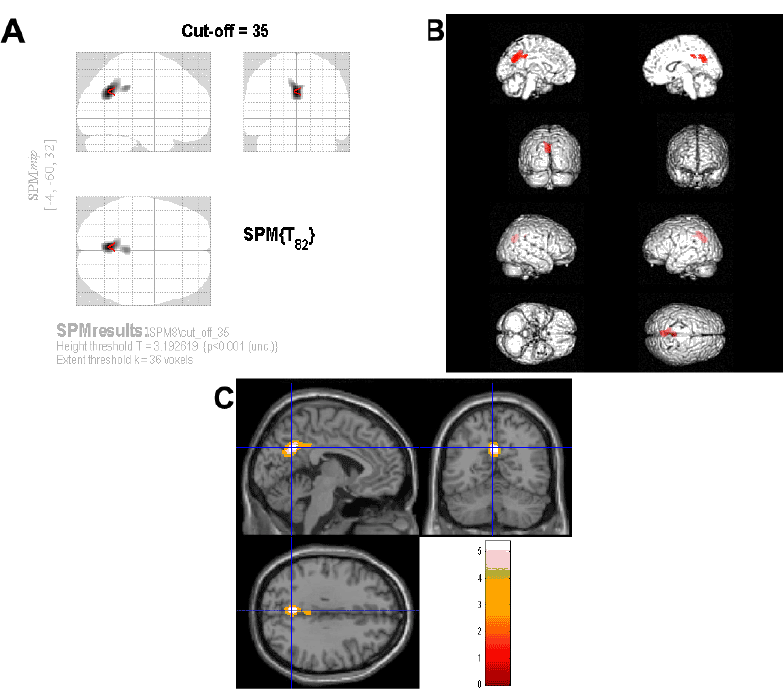
| Figure 1: Linear regression analysis between the RBANS scores andthe rCBF SPECT. The results were projected on the standard MRItemplates provided by SPM8 and arranged from top to bottom:medial left, medial right, lateral right, lateral left, anterior, posterior,top and bottom views. The red areas indicated a significantly lowperfusion with the decrease of each of the RBANS scores describedbelow. DM=Delayed Memory; IM=Immediate Memory;VC=Visuospatial/Constructional skills. |