|
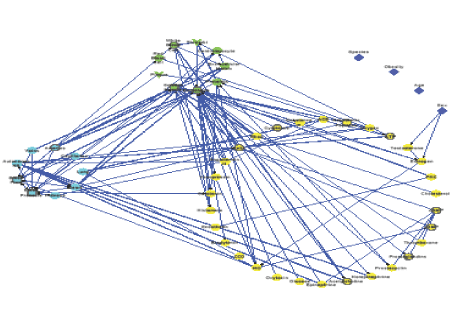
| Figure 1: Vasculomic Network: cardiovascular physiology map for omics study design. |
| Key components of cardiovascular physiology are represented as nodes: cyan nodes = organ-level domain, green nodes = cellular domain, yellow nodes = molecular domain, dark-blue nodes = organism domain. Nodes with a thick border indicate heterogeneity. The interactions between components are displayed as either arrows, which indicate cause-effect relationships, or dotted lines, which indicate associations. This figure was created using freely available software, Cytoscape (cytoscape.org), version 2.8.1 [75]. The network structure was created by N. Schaible based on “Vascular Pharmacology” (Ch. 5) by O’Rourke, Vanhoutte, and Miller [76]. |
| This “physiological map” displays the primary components involved in vascular physiology which are represented as nodes, color-coded and grouped according to spatial domain. Note that the picture that emerges from a high-level inspection of the map is one of multiple levels of feedback between molecular, cellular, and organ-level operation. The relationships between components are represented with either solid arrows (cause/effect) or dotted lines (association). Therefore each line connecting a pair of nodes represents distinct physiological purpose. For example, a dotted-line connecting “cardiomyocytes” with “heart” is based upon the knowledge that the cardiomyocytes are constituents of the heart organ. Cardiomyocytes have a singular cellular identity, but also are collectively associated with the heart organ. An arrow in the physiological map, on the other hand, indicates a cause-and-effect relationship. For example, a unidirectional arrow from “blood flow” (organ domain) to “endothelial cell” (cell domain) reflects the understanding that endothelial cells are sensitive to shear stress which is attributed to blood flow. Even without concern of the identity of nodes and lines, a key feature easily visualized on this map, is the intimate interconnectedness across all spatial domains – which are certainly not unidirectional from gene to organ. |
| Note also that some nodes are more heavily interconnected than others; the nodes which have the most connections are the endothelial cells and the smooth muscle. This is because these two components are major integrators of vascular control. Vascular smooth muscle, by contracting or relaxing, has the capacity to significantly impact pressure/flow responses within the vasculature and as a result plays the important role as main effector of cardiovascular control. Smooth muscle, on its own, is sensitive to “external stimuli” provided by the autonomic nervous system. However, smooth muscle also receives input from endothelial cells, also a hub of control. The endothelial cells receive many inputs from the local environment, such as hormones, and respond to these cues mainly by affecting the contractile state of the smooth muscle. Also, the processing of input to output occurs in the molecular domain which involve many intermediates – most notably calcium ions. The central role of the smooth muscle and endothelial cells is another key point illustrated in the diagram. |