 |
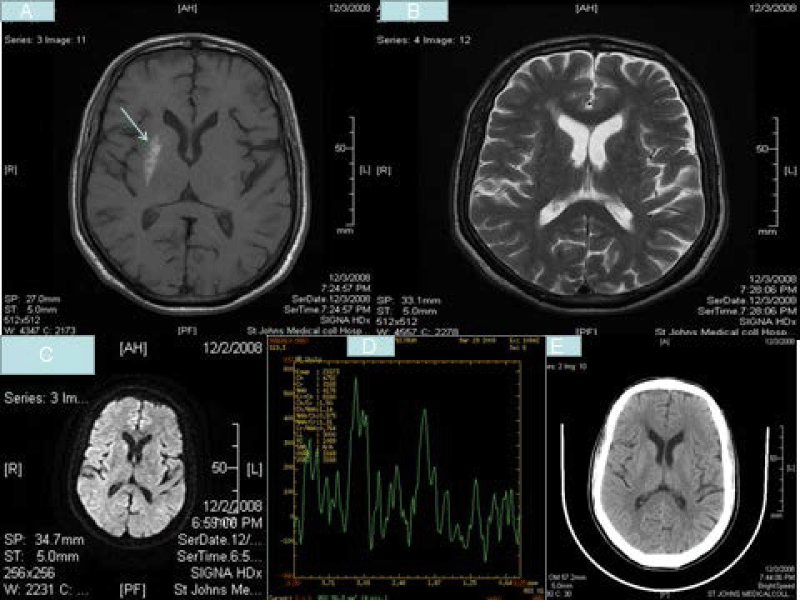
| Figure 1: T1W axial image (A) showing striatal hyperintensity(arrow),T2W axial images(B) showing hypointensity, Diffusion weighted images(C) showing no restriction, magentic resonance spectroscopy(D) showing reduced NAA peak and CT axial images(E) showing hyperdensity in striatum (MRI was done by General Electric HBX, 1.5 Telsa machine, 2007 model with 4.3 version software). |