|
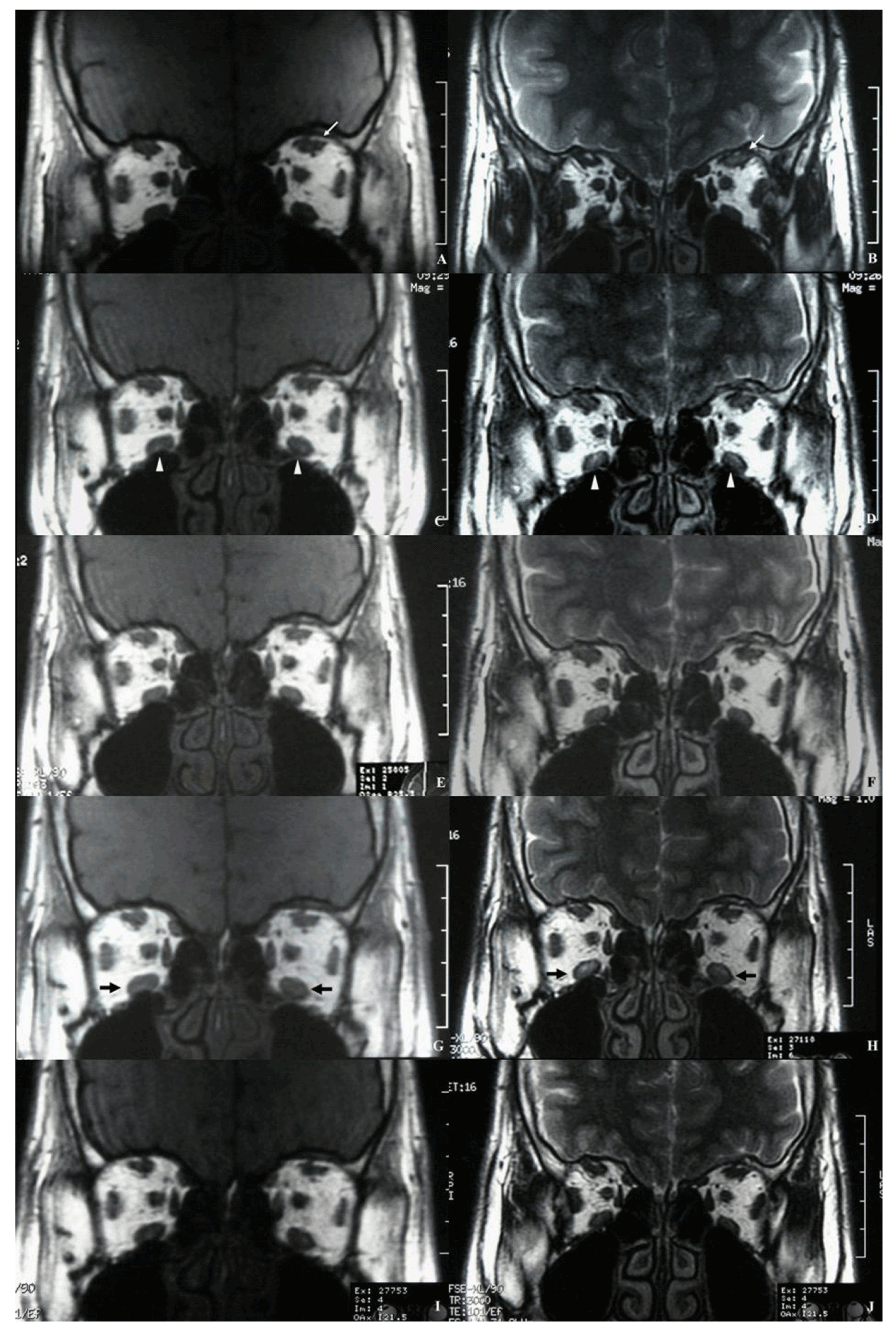
| Figure 2: Coronal sections of magnetic resonance imaging. A, B. Examination at first visit. A. T1-weighted imaging. B. T2-weighted imaging. The left superior rectus muscle is swollen with low intensity area on T1-weighted imaging and high intensity area on T2-weighted imaging (white arrows). C, D. Examination 3 months after triamcinolone acetonide injection. C. T1-weighted imaging. D. T2-weighted imaging. The inferior rectus muscles on both sides are enlarged with low intensity areas on T1-weighted imaging and high intensity areas on T2-weighted imaging (white arrow heads). E, F. Examination 1 week after initial steroid pulse therapy. E. T1-weighted imaging. F. T2-weighted imaging. The high intensity areas in the left superior rectus muscle and the bilateral inferior rectus muscles on T2-weighted imaging have almost disappeared. G, H. Examination 2 months after initial steroid pulse therapy. G. T1-weighted imaging. H. T2-weighted imaging. Low intensity areas on T1-weighted imaging and high intensity areas on T2-weighted imaging are seen in the inferior rectus muscles on both sides (black arrows). I, J. Examination 1 month after second steroid pulse therapy. I. T1-weighted imaging. J. T2-weighted imaging. The high intensity areas in the bilateral inferior rectus muscles on T2-weighted imaging have almost disappeared. |