 |
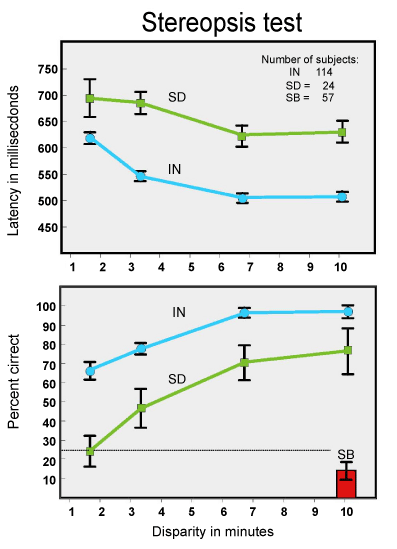
| Figure 10: Performance on the stereopsis test showing percent correct performance and response latencies for normal (IN), stereo deficient (SD) and stereoblind (SB) subjects using four different levels of disparity. The black bars show the +/- standard error values for each condition. |