 |
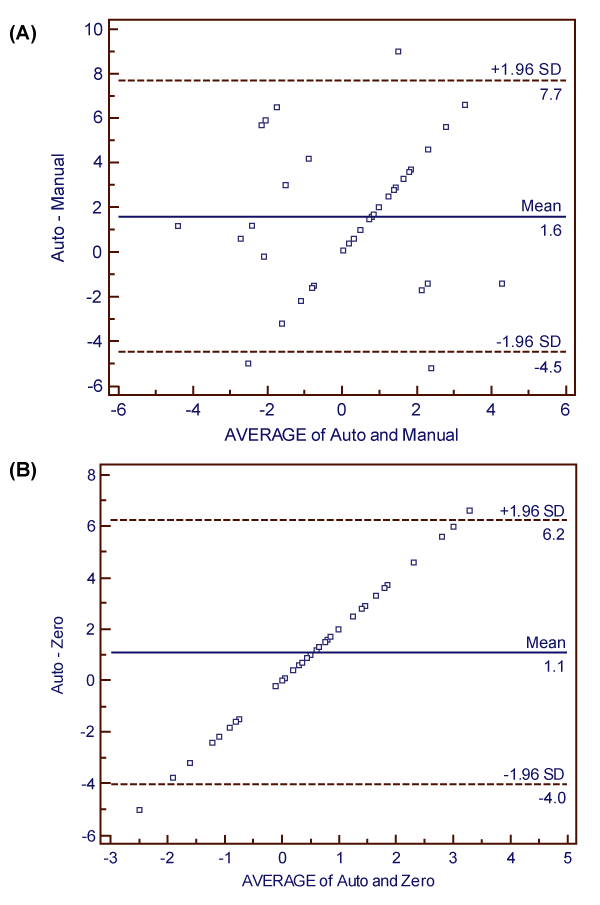
| Figure 4: (A) Bland-Altman plot showing the difference between the automated and manual methods. The mean difference in measurements was 1.6 ± 6.1 degrees, and the range of agreement was 6.1 degrees. (B) Bland-Altman plot showing the difference between zero value and the measurements obtained using the automated method. The range of agreement was 5.1 degrees, which was 1 degree lower than the agreement range between the manual and automated methods. |