 |
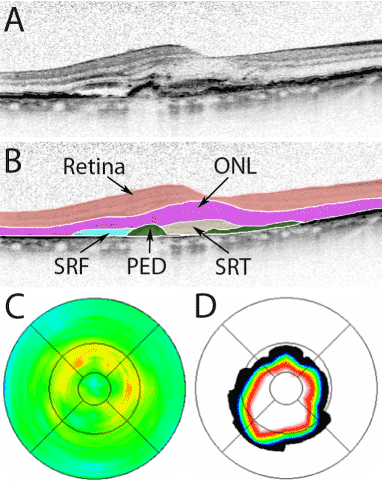
| Figure 2: Quantitative analysis of spectral domain optical coherence tomography images (SDOCT) using the reading center software “3DOCTOR” developed by the Doheny Imaging Exploration and Software Engineering Laboratory (DIESEL). Boundaries of various retinal and subretinal spaces are manually drawn on each SDOCT scan. A: SDOCT B-scan, B: SDOCT B-scan after manually delineating the boundaries of various retinal and subretinal spaces. Volumes are calculated by the software for all graded spaces. C: Thickness map example for the neurosensory retina D: Thickness map example for pigment epithelial detachment. |