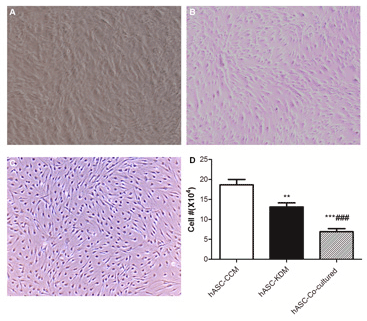
 *means comparison of hASC-KDM and hASC-co-cultured group with hASCCCM
group.
#means comparison between hASC-KDM group and hASC-co-cultured
group.
**means p<0.001, ***or ###means p<0.0001
 *means comparison of hASC-KDM and hASC-co-cultured group with hASCCCM
group.
#means comparison between hASC-KDM group and hASC-co-cultured
group.
**means p<0.001, ***or ###means p<0.0001
 |
| Figure 3: Phase-contrast images and cell counts after 16 days using 3 different culture procedures. A) hASCs that were grown in CCM. B) hASCs that were grown in KDM. C) hASCs in co-culture system. D) Cell count in different medium on day 16 showed hASCs start to grow slower as differentiation progressed. Original magnification 4x for A-C. |