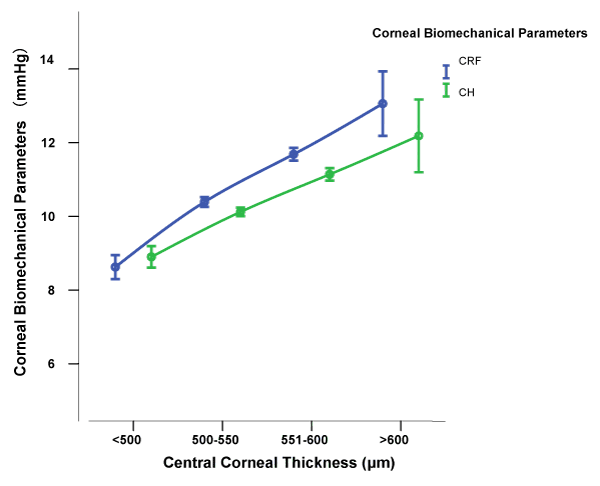
Figure 2:
The distribution of CH and CRF in different CCT groups.