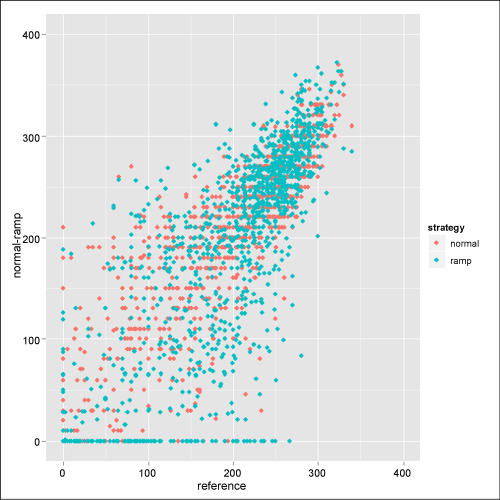
Figure 6:
Displays point-wise presentations of the local thresholds of the pulsed RAMP and the NS when compared with the reference. Note the increased number of zero-answers (onto the y-axis) with the pulsed RAMP strategy.