 |
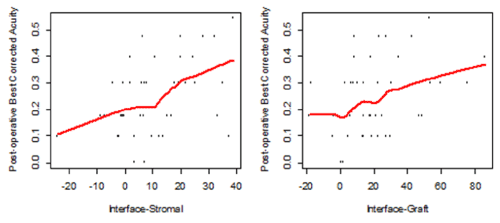
| Figure 5: Left: Scatter plot of Post-operative BSCVA (logMAR) vs. the difference between measured interface and stromal scattering (Si-Sst). Right: Scatter plot of the Post-operative BSCVA (logMAR) vs. the difference between the measured interface and graft scattering (Si-Sg). |