|
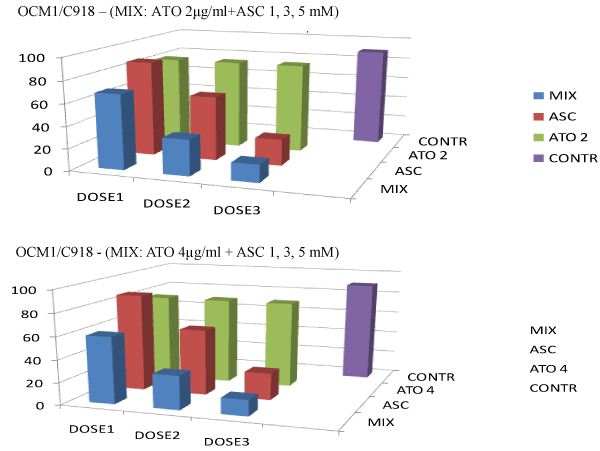
| Figure 4: Diagram reporting the comparative cytotoxicity of both ASC and ATO after exposure of UM cell lines (OCM1 and C918) for two hours (and subsequent incubation in ASC/ATO free medium for 18-24 hours). Purple bars=control (no treatment) sample; green bars=ATO 2 μg/ml (upper diagram) and 4 μg/ml (lower diagram); red bars=ASC (1, 3, and 5 mM/ml); blue bars=mix of ATO 2 μg/ml (upper diagram) with ASC (1, 3, 5 mM) and ATO 4 μg/ml (lower diagram) with ASC (1, 3, 5 mM). Dose 1 (upper diagram)=ATO 2 μg/ml (green bar); ASC 1 mM (red bar), mix of both (blue bar); Dose 1 (lower diagram)=ATO 4 μg/ml (green bar), ASC 1 mM (red bar), mix of both (blue bar). Dose 2 (upper diagram)=ATO 2 μg/ml (green bar); ASC 3 mM (red bar), mix of both (blue bar); Dose 2 (lower diagram)=ATO 4 μg/ml (green bar), ASC 3 mM (red bar), mix of both (blue bar). Dose 3 (upper diagram)=ATO 2 μg/ml (green bar); ASC 5 mM (red bar), mix of both (blue bar); Dose 1 (lower diagram)=ATO 4 μg/ml (green bar), ASC 5 mM (red bar), mix of both (blue bar). |