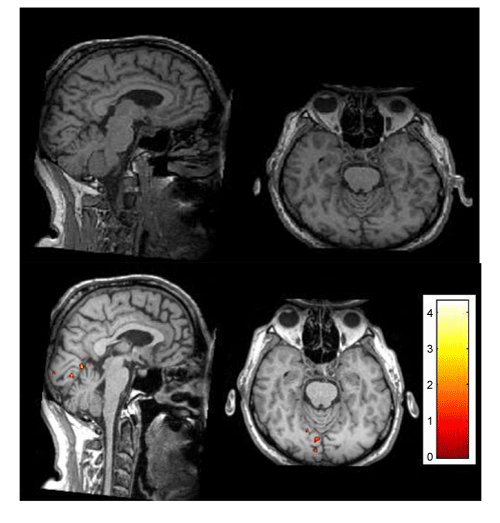
Figure 4:
Lack of BOLD signals in the severely affected left eye (at the top) compared with the right eye (at the bottom) in the same slice. The red to orange color scale indicates the statistical significance of t values calculated for each woxel.