 |
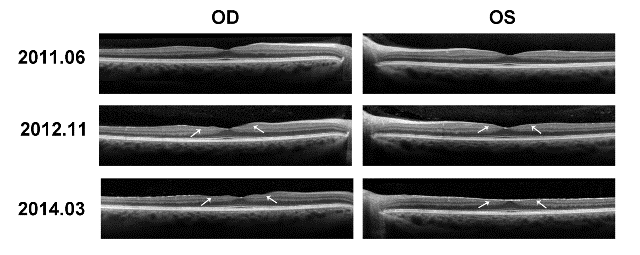
| Figure 1: Optical Coherence Tomography (OCT). Images are labeled according to the date taken; each date corresponds to one set of left and right eye images. 2011.06 and 2012.11 depict normal retinal layers throughout. The left and right eye images taken 2014.03 are notable for left eye greater than right eye thinning of the retinal nerve fiber layer, ganglion cell layer, inner plexiform and inner nuclear layers with loss of the foveal pit in the left eye. |