|
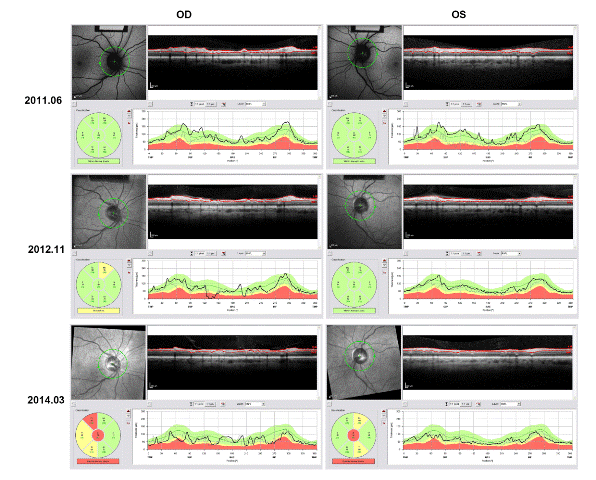
| Figure 4: Retinal Nerve Fiber Layer (RNFL) Thickness Map. RNFL map showing bilateral decrease in RNFL thickness over time with left RNFL loss greater than right. Green corresponds to normal RNFL thickness, yellow borderline, and red below normal and borderline thickness. Anatomic orientation - T: Temporal, S: Superior, I: Inferior, N: Nasal. |