 |
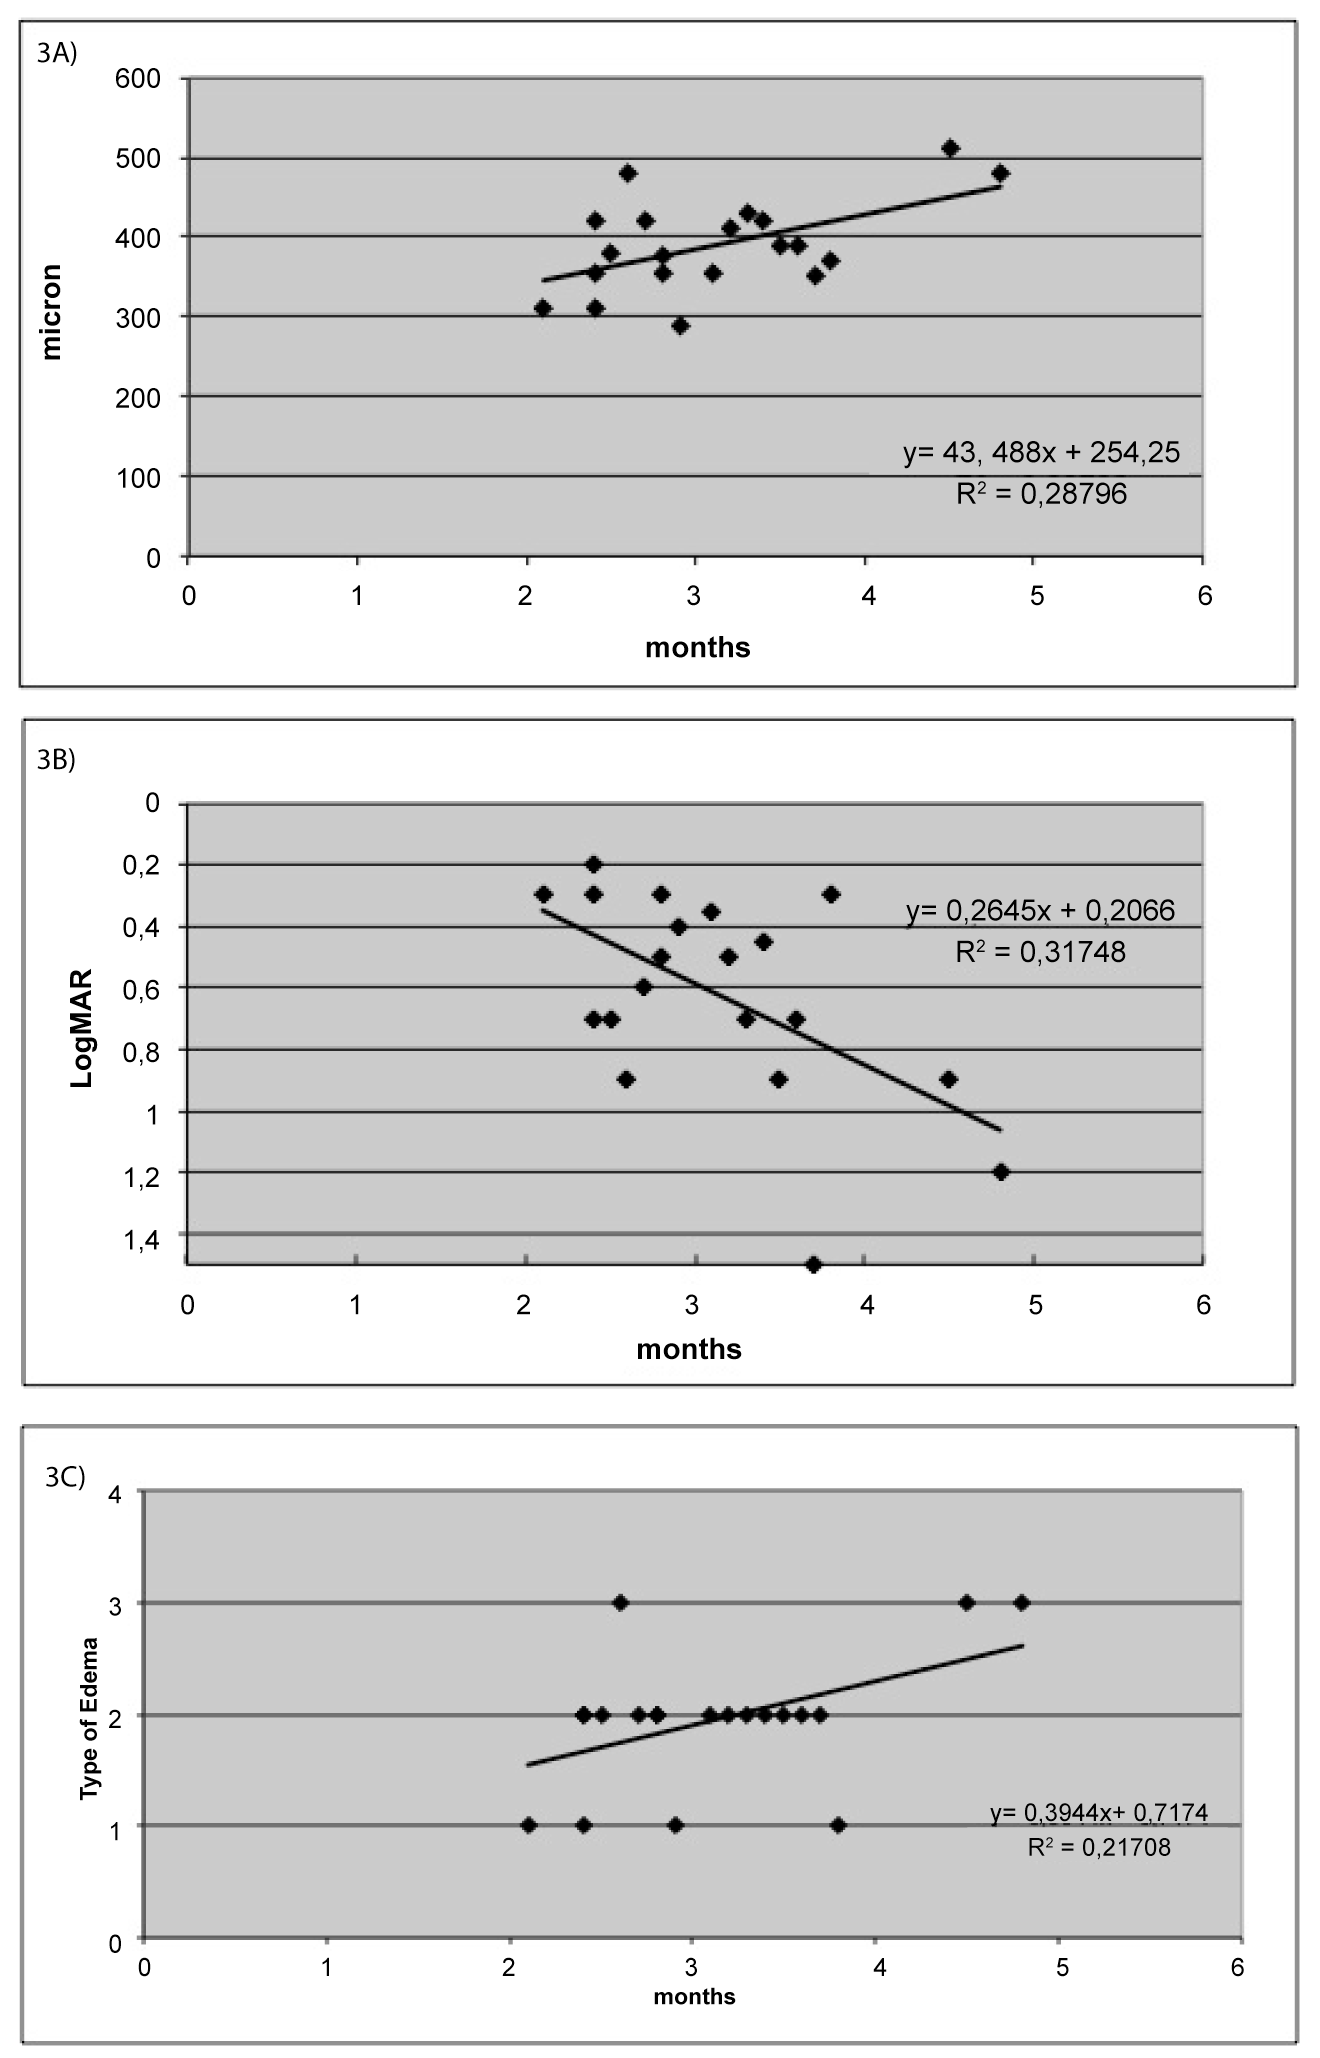
| Figure 3: SO permanence and macular edema. a) correlation between time of SO permanence and Macular Thickness (r: 0.53); b) correlation between time of SO permanence and Visual Acuity (r: 0.56); c) correlation between time of SO permanence and type of macular edema:- 0: Normal Macula; 1: Mild Edema <350 μm Thickness; 2: Medium Edema Between 350-450 μm; 3: Severe Edema >450 μm (r: 0.41). Dots represent each eye data, continuous line represents the statistical tendency. The equation defines the statistical correlation. |