 |
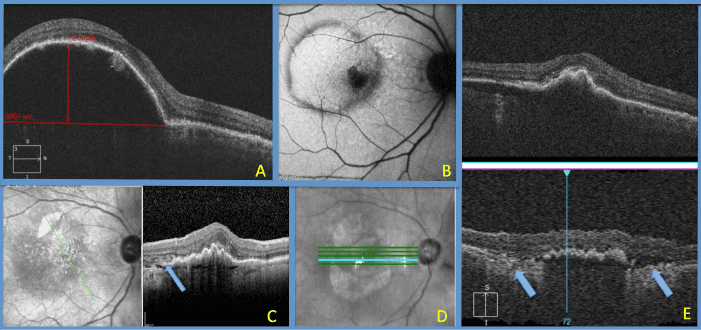
| Figure 10: Patient 8: Before Treatment and After two tears, A: OCT demonstrating height of PED prior to RPE tear, B: FAF of PED; C: First small superior tear of PED as seen on infrared image after the 11th injection. Arrow indicates torn RPE, D: Two RPE tears seen on infrared image after the 12th injection, E: OCT images at 90 and 180 degree of the RPE tears seen in image D. The tears are seen in the inferior image with arrows indicating the absent RPE and increased transmission. The superior image shows the contracted RPE and flattened PED. |