 |
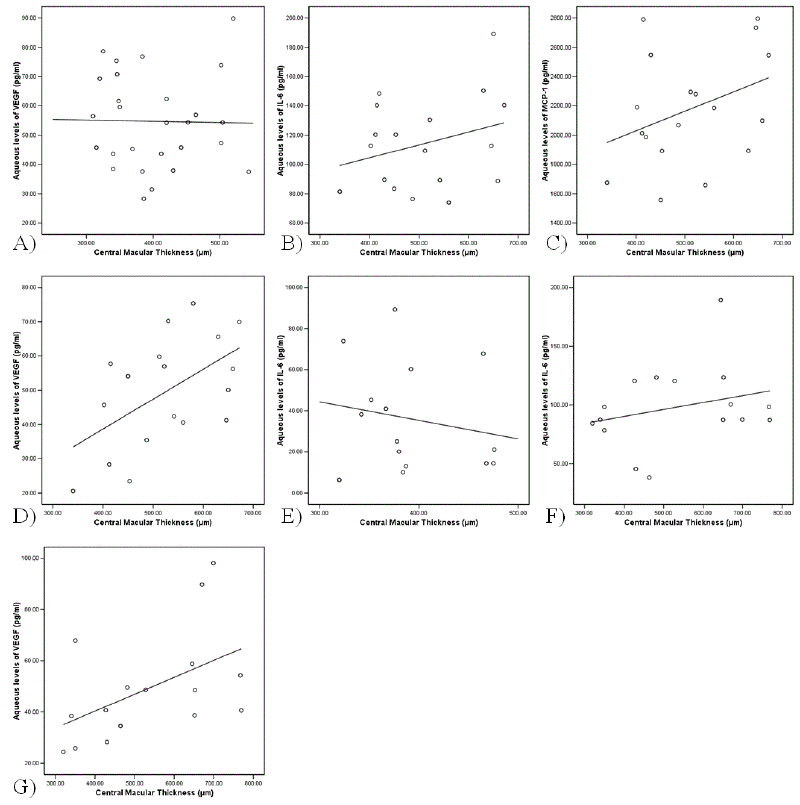
| Figure 4: Scatterplots of the correlations between central macular thickness (CMT) and aqueous humor concentration of cytokines in each group that cytokines were related with development of each DME pattern. The aqueous concentrations of VEGF were correlated significantly with the degree of central macular thickness in the CME group (D) (r=0.346, P=0.045) and in the combined group (G) (r=0.559, P=0.024).The other cytokines were not correlated with the degree of CMT in OCT of SDRT, CME, SRD and combined pattern. VEGF in the SDRT (A)(r=-0.096, P=0.634), IL-6 in the CME (B) (r=0.164, P=0.515), MCP-1 in the CME (C) (r=0.247, P=0.288), IL-6 in the SRD (E) (r=-0.189,P=0.499), IL-6 in the combined group (F) (r=0.291, P=0.274). |