 |
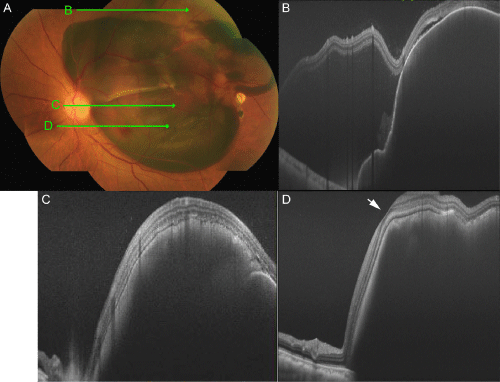
| Figure 2: OCT of the patient before injection. A: Fundus photograph (Figure 1). B: Large PEDs and subretinal fluid were observed. C: Subretinal hemorrhage and large PEDs were observed. D: Subretinal hemorrhage was observed. The white arrow shows the fovea. |