 |
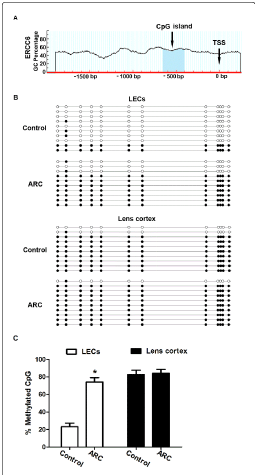
| Figure 2: Methylation status of the promoter of ERCC6 in LECs and lens cortex of control and ARC lens (N=15 each) (A) The position of CpG island in ERCC6 . (B) Representative of DNA sequences of ERCC6 CG-rich sequence of the CpG island in the DNA from LECs and cortex of the individual control lenses and ARC lenses. Each row of circles represents a single plasmid clone; each column represents a CpG site. Open and close circles represent unmethylated and methylated CpG sites, respectively. Ten single clones are shown. (C) In LECs, the ARC lens displayed hypermethylation compared to the control group. *: P<0.01 vs.control. |