 |
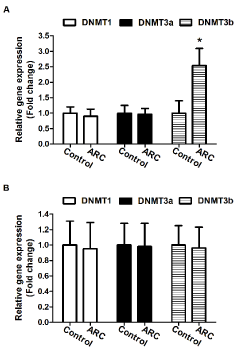
| Figure 3: Relative expression of mRNA of DNMTs in LECs and lens cortex of control and ARC lens (N=15 each) (A) Quantitative RTPCR analysis of the mRNA of DNMTs in LECs of control and ARC lens. (B) Quantitative RT-PCR analysis of the mRNA of DNMTs in cortex of control and ARC lens. Values represent mean ±SD. *P <0.01. |