 |
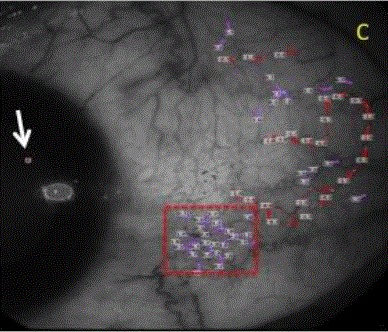
| Figure 1C: Analysis of the BF velocity of the conjunctiva. The positive values with the purple lines are representing the veins, the negative values with the red lines are representing the arteries, the numbers are the BF velocity in mm/s. Values in the area with the red-dashed square are representing the BF data of the area with the vascular abnormalities. The symbol on the cornea (white arrow) marks the direction of the arterial BF. |