 |
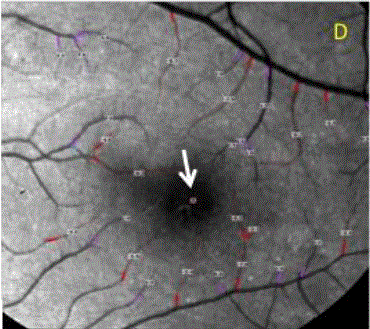
| Figure 1D: Analysis of the BF velocity of the central retina imaged in a 20 degrees red-free mode. Note that the positive values with the purple lines are representing the veins, the negative values with the red lines, which indicate BF moving away from the heart, are showing the arteries. The numbers closed to vessel segments outlined are the mean BF velocity in mm/s. The avascular zone was evident in the fovea. The symbol in the fovea (white arrow) is indicating the direction of the arterial BF. Note that no clinical signs of DR are present. |