|
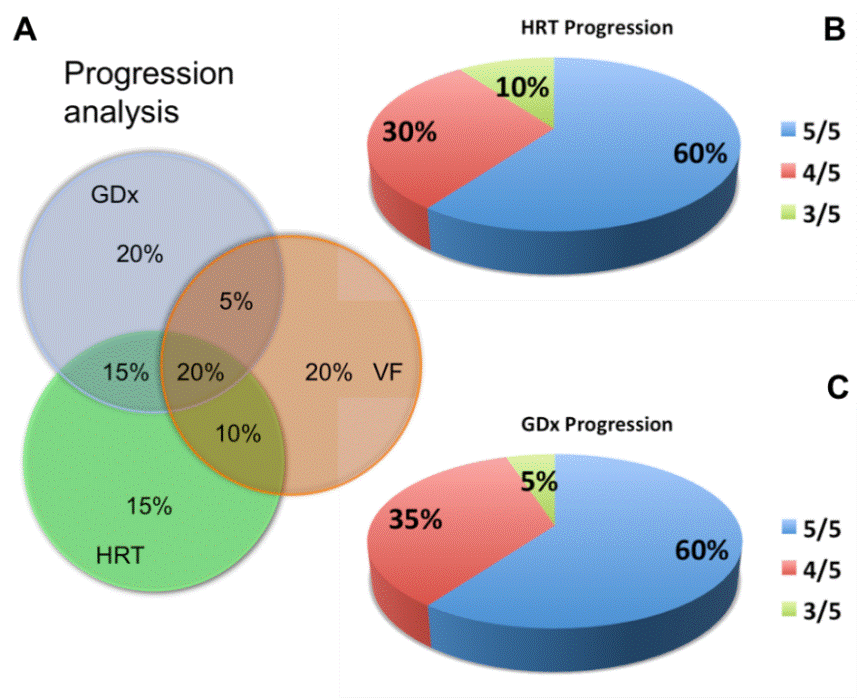
| Figure 5: Comparison between HRT and GDx findings. The Venn diagram shows progression of patients with 5/5 parameters of GDx-HRT overlapping with VF. Only 20% of patients showed progression in all three modalities (A). HRT analysis similarly showed progression in 5/5 parameters in 60% of patients, 30% in 4/5 and 10% in 3/5 (B). There was progression in 5/5 GDx parameters in 60% of patients, 4/5 in 35% and 3/5 in 5% of examined patients (C). |