|
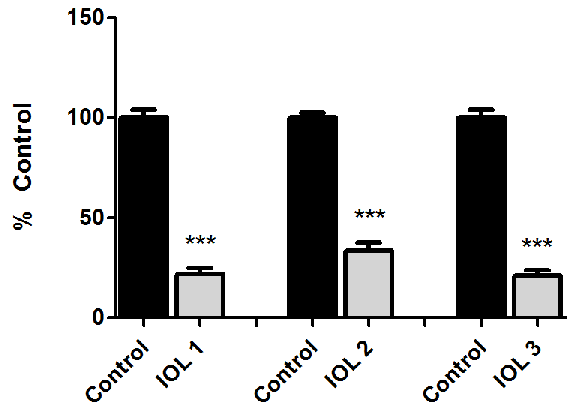
| Figure 5: Area under the IOL covered by lens epithelial cells. IOLs were coated with APCs or served as uncoated controls. The area was measured in μm2 and the results normalized and expressed as percent of control. All three IOLs showed a strong significant reduction in the amount of migrated cells underneath the IOL (p<0.001). No statistical difference was seen between the three IOLs however (p>0.05). |