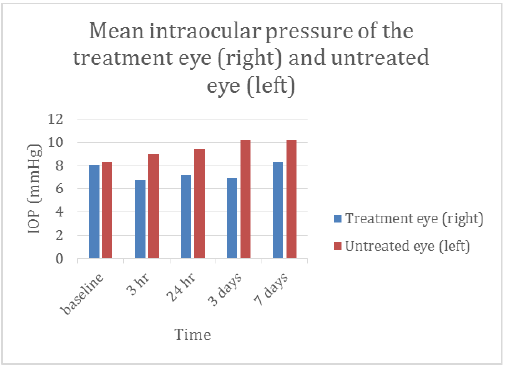
Figure 1:
Mean intraocular pressure of the treatment eye (right) and untreated eye (left) at different time points.