| |
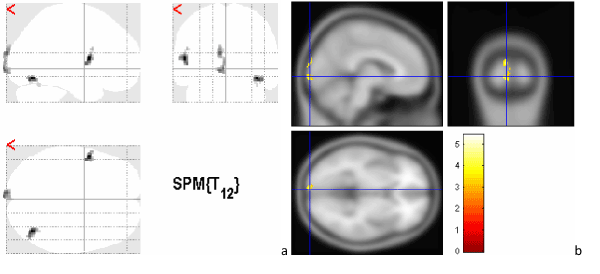
| Figure 5: illustrates the regions with statistically high activation in the control group in comparison to the patients, with stimulation using a black and white checkerboard (8 subjects in each group. a) projection of activations in the axial, sagittal and coronal directions, b) orthogonal slices of the selected region. |