 |
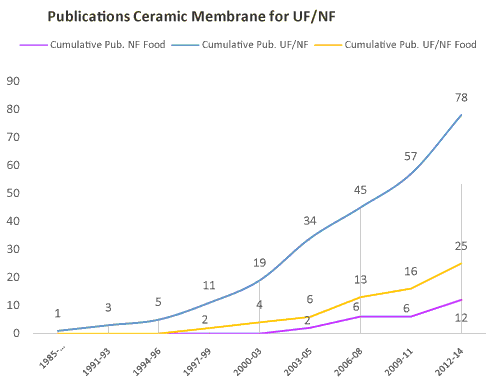
| Figure 1: a) (blue line) the curve indicates the total amount of publications found up to the indicated period concerning UF and NF via ceramic membrane. b) (orange line) the curve indicates the total amount of publications found up to the indicated period concerning UF and NF via ceramic membrane employed in food processes; c) (violet line) the curve indicates the total amount of publications found up to the indicated period concerning NF via ceramic membrane employed in food processes. |