 |
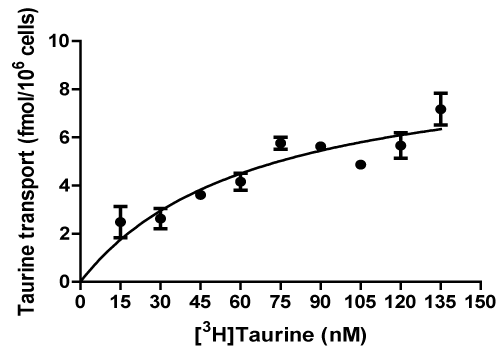
| Figure 4: Curve of saturation of [3H]taurine transport. Was performed in the presence of different concentrations of [3H]taurine of 15 to 135 nM, with a time of preincubation of 5 min and 25 s of incubation at 37 °C. Fit hyperbola 1 site. R2 = 0.92, n = 4. Vmax = 9.77 ± 1.46 fmol/106 cells and Kt = 0.08 ± 0.04 μM. Kt and Vmax were determined by the method of double reciprocal of Lineweaver-Burk. Each value is the mean ± SEM, n = 4. |