 |
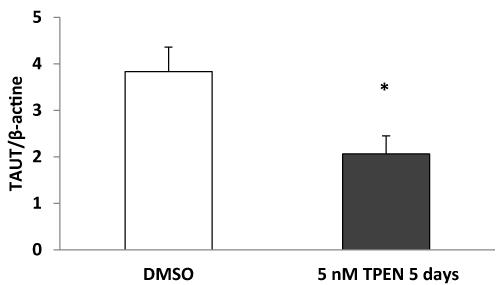
| Figure 7: Densitometry analysis of the relative levels mRNA of TAUT. The results are expressed as the ratio of the intensities of the band corresponding to TAUT and the β-actin band. Each value is the mean ± SEM, n = 6. * p 0.05 with respect to DMSO. |