|
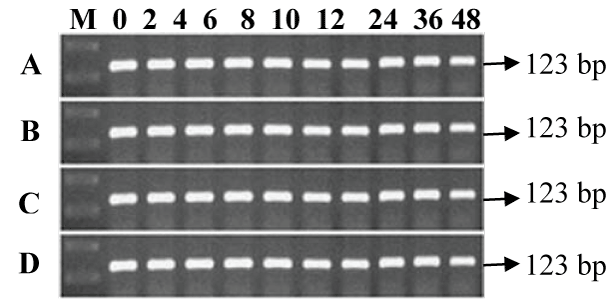
| Figure 1: RT-PCR time course analysis of ef1α( 123 bp, used as an internal control) expression in different tissues of white shrimp Litopenaeus vannamei at 0, 2, 4, 6, 8, 10, 12, 24, 36 and 48 h post injection of WSSV. Lane M- marker; Land 2 to 12 as 0, 2, 4, 6, 8, 10, 12, 24, 36 and 48 h. A. ef1αexpression in gill tissue B. ef1α expression in muscle tissue C. ef1αexpression in hepatopancrease D. ef1αexpression in pleopod. |