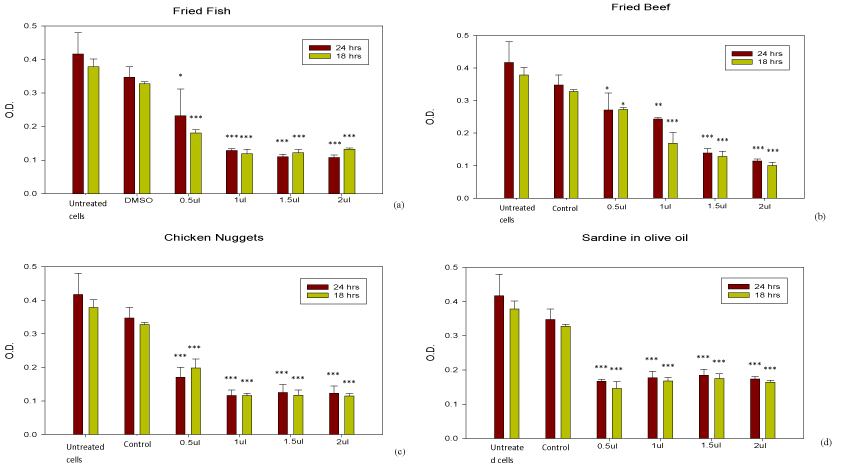
 Data is represented as the mean ± SD (n = 3).
***, significantly different when compared to controls (p < 0.001)
**, significantly different when compared to controls (p < 0.01)
*, significantly different when compared to controls (p < 0.05)
 Data is represented as the mean ± SD (n = 3).
***, significantly different when compared to controls (p < 0.001) **, significantly different when compared to controls (p < 0.01) *, significantly different when compared to controls (p < 0.05) |
| Figure 3: Bar graphs indicating the results of MTT cell viability assay after 18 and 24 hrs treatment of HepG2 cells with various sample extracts (a) fried fish (b) fried beef (c) chicken nuggets and (d) sardine in olive oil. |