 |
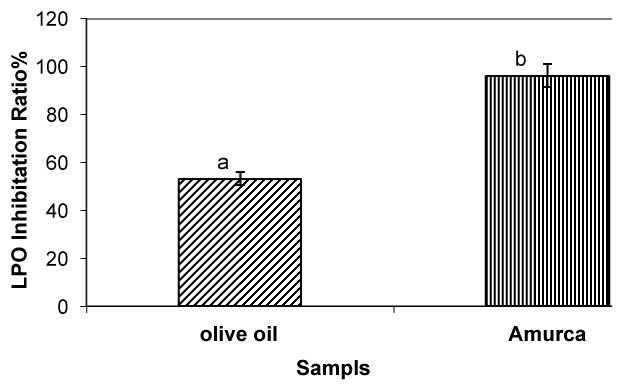
| Figure 1: Effect of olive oil and amurca samples on lipid peroxidation (LPO) inhibition percent. Values are expressed as mean ± SEM (n=3). P-values were calculated by Students t-test. Means with different superscripts (a,b) differ significantly at p<0.05. |