 |
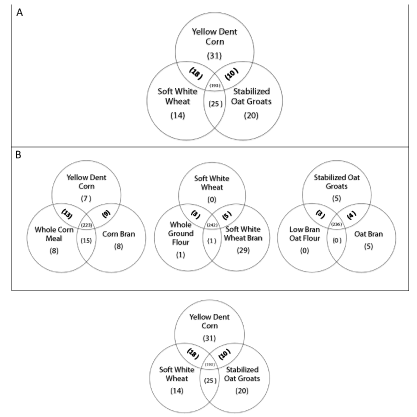
| Figure 5: Venn diagram showing number of detected biochemicals in the intact grain (A); Venn diagrams showing number of detected metabolites in the intact grain, milled whole grain flour/meal and bran fractions for yellow dent corn, stabilized oat groats and soft white wheat (B). |