 |
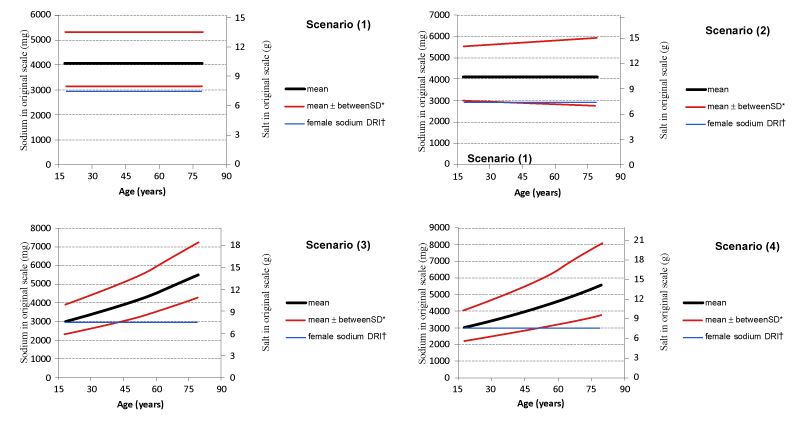
| Figure 1: Graphs of the settings of the 4 scenarios for simulation studies in the nutrient’s original scale. Amounts of sodium and salt in the original scale: Y-axis (left), sodium; Y-axis (right), salt. *between SD=between-subject standard deviation. †Salt dietary reference intake in women; 7.5 g salt is equivalent to 2949 mg sodium. |