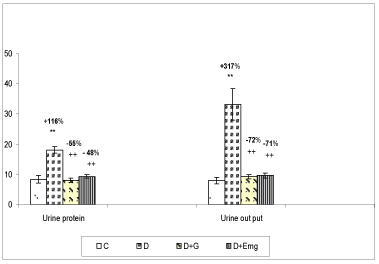
 C: control (normal) rats; D: Diabetics rats; D+G: Diabetic rats treated with Garlic extract; D+ EMg: Diabetic rats treated with α-tocopherol+Mg.
Values are the mean of 6 measurements ± SD.
**Significant difference as compared to control rats (C) (p ≤ 0.01).
++Significant difference between treated diabetic rats (D+G; D+EMg) and diabetic rats (D).