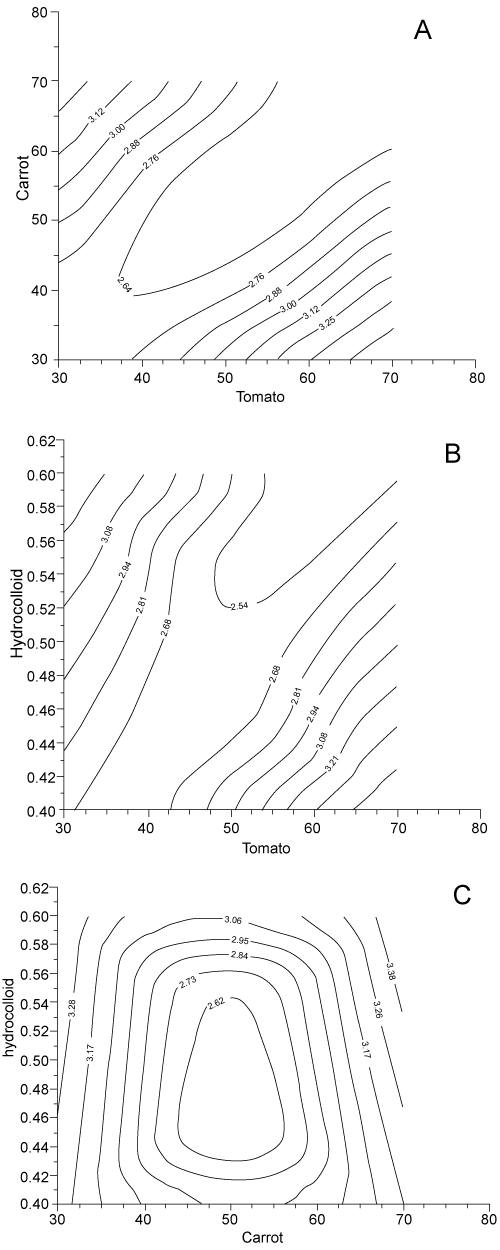
(a) Surface plot of Tomato-carrot juice.
(b) Surface plot of Tomato juice and hydrocolloid.
(c) Surface plot of Carrot juice and hydrocolloid.
|
| Figure 4: Contour Plot for the effect of acceptability on tomato-carrot juice
blend. (a) Surface plot of Tomato-carrot juice. (b) Surface plot of Tomato juice and hydrocolloid. (c) Surface plot of Carrot juice and hydrocolloid. |