 |
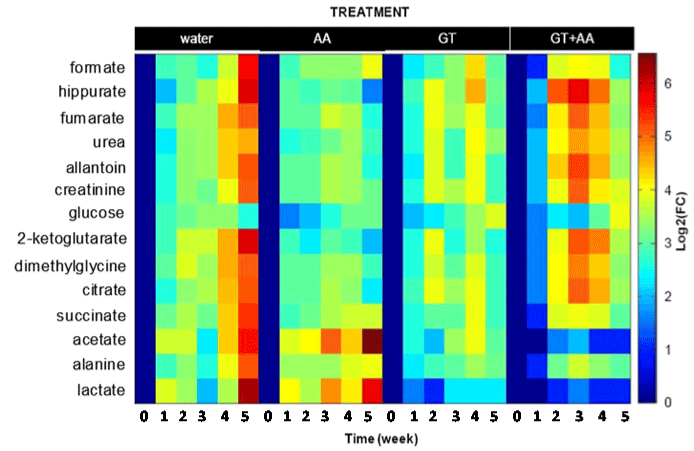
| Figure 2: Fold changes in metabolite excretion over time under four treatments: water, AA, GT and GT+AA. This was to eliminate systematic variations and emphasize treatments-induced variations. Color intensities reflected the natural logarithmic fold-change as referenced to the first week. |