 |
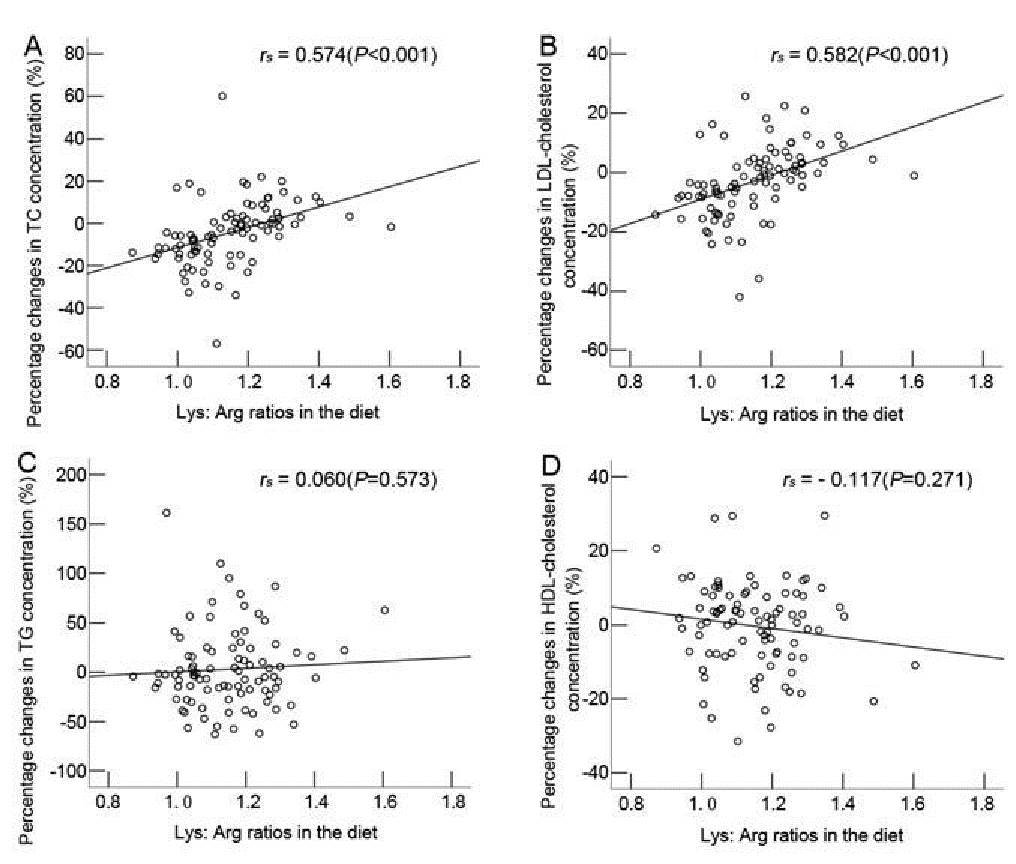
| Figure 2: Relations between the dietary Lys: Arg ratio and the percentage change in serum total cholesterol (TC) (A), LDL-cholesterol (B), TG (C) and HDL-cholesterol (D) concentration in 90 subjects. The values deviated from normality and were expressed as Spearman’s rank correlation coefficients (rs). |