 |
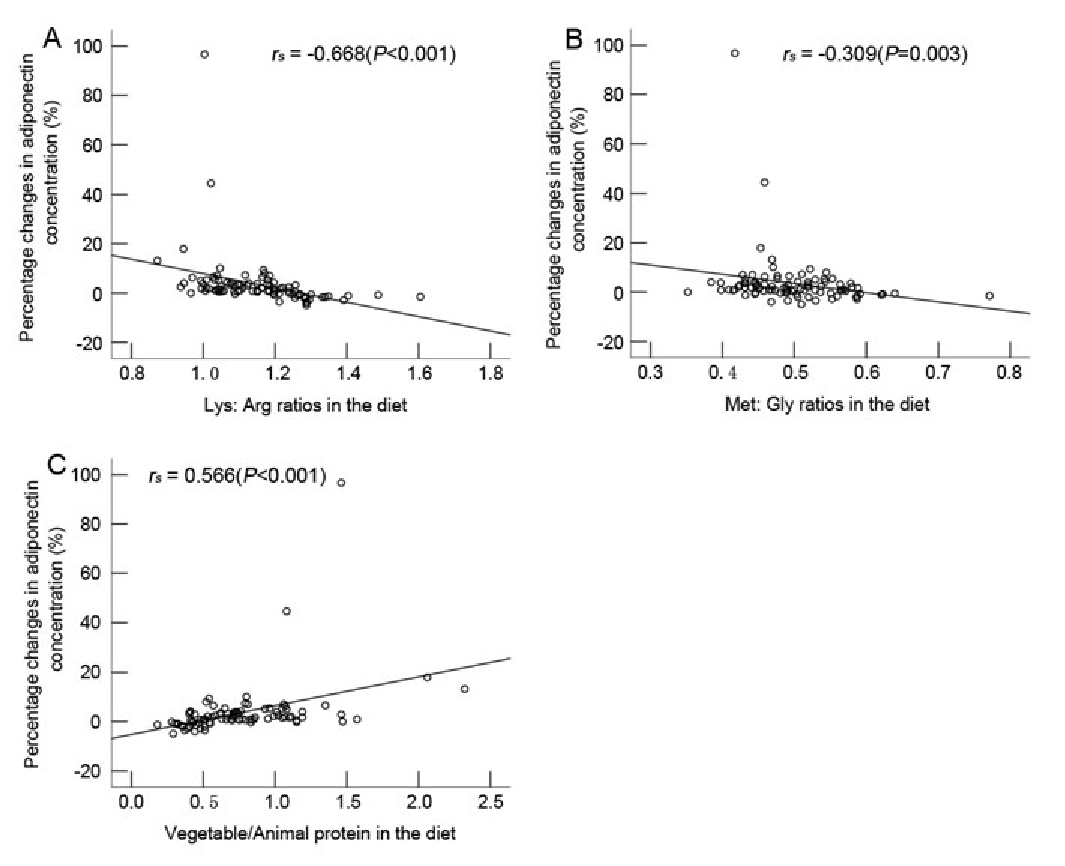
| Figure 3: Relations between the percentage changes in adiponectin and the dietary Lys: Arg ratio (A), Met: Gly (B) and the dietary vegetable protein/animal protein ratio (C) in 90 subjects. The values deviated from normality and were expressed as Spearman’s rank correlation coefficients (rs). |