 |
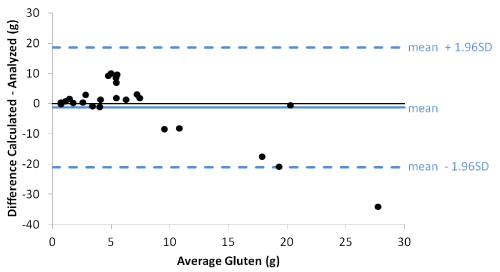
| Figure 2: Bland-Altman Plot of Analyzed (ELISA) in Relation to Calculated Gluten (Osborne Calculation) for 25 Foods Assessed. This figure illustrates the variability in the difference between the calculated and analyzed gluten; this variability increased as the average gluten content increased. |