 |
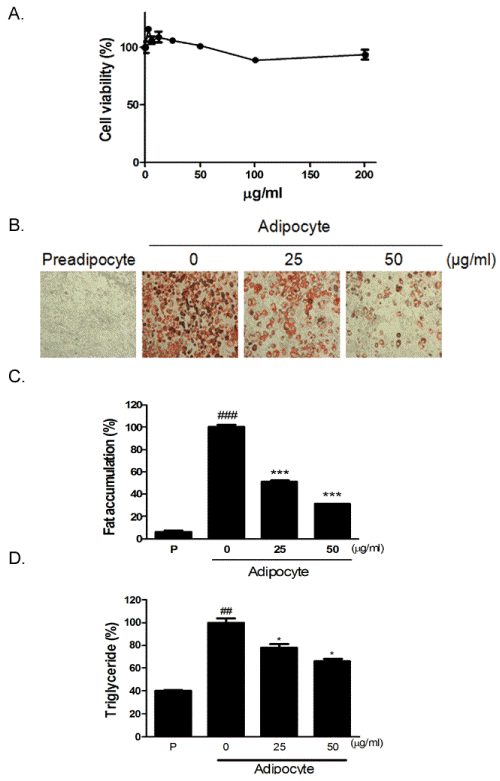
| Figure 1: Effect of EPK on the differentiation of 3T3-L1 adipocytes. (A) 3T3- L1 cells were treated with various concentrations of EPK (0, 3.125, 6.25, 12.5, 25, 50, 100 and 200 μg/ml) for 24 h and then the cell viability was evaluated by the MTT assay. (B) 3T3-L1 preadipocytes were treated with various concentrations of EPK during differentiation. On day 8, the differentiated cells were stained with Oil-red-O dye and visualized under inverted microscopy at 100x magnifications. (C) After dissolving and cellular lipid retained Oil-Red-O in isopropanol, adipocyte expression was estimated by measuring O.D. using microplate reader (Sunrise, TECAN, Mannedorf, Switzerland) at 510 nm. (D) Level of intracellular triglyceride. |