 |
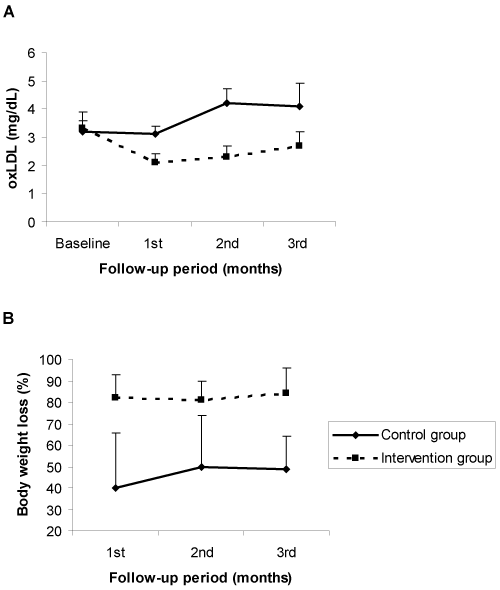
| Figure 2: oxLDL serum levels and fat mass. A) Comparison between oxLDL levels in both groups. B) Comparison between body weight loss percentages in both groups. Body weight loss percentage refers to the body weight loss percentage that belongs to fat. Results are expressed as mean ± SE. *p≤0.05. |