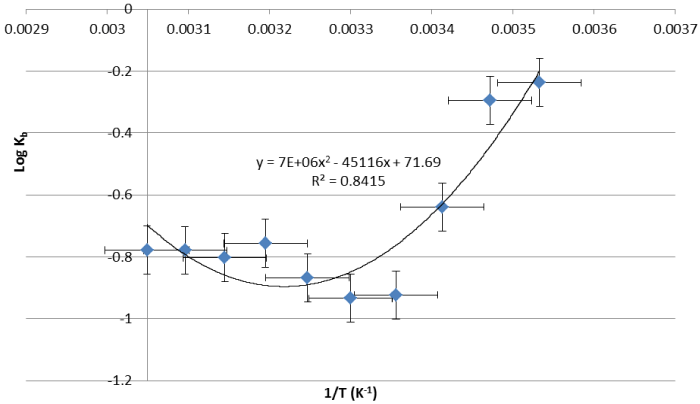
Figure 4:
Arrhenius plot of inactivation rates: Log K versus 1/T of PPO activity extracted from
D. rotundata
.